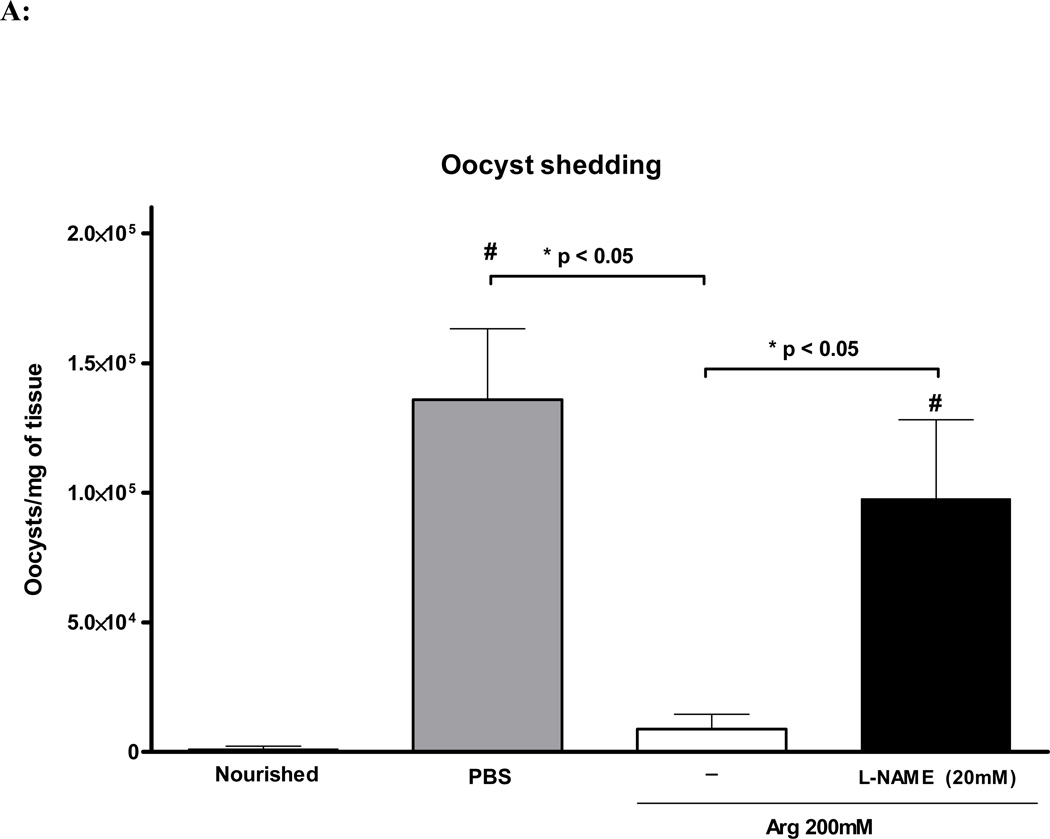
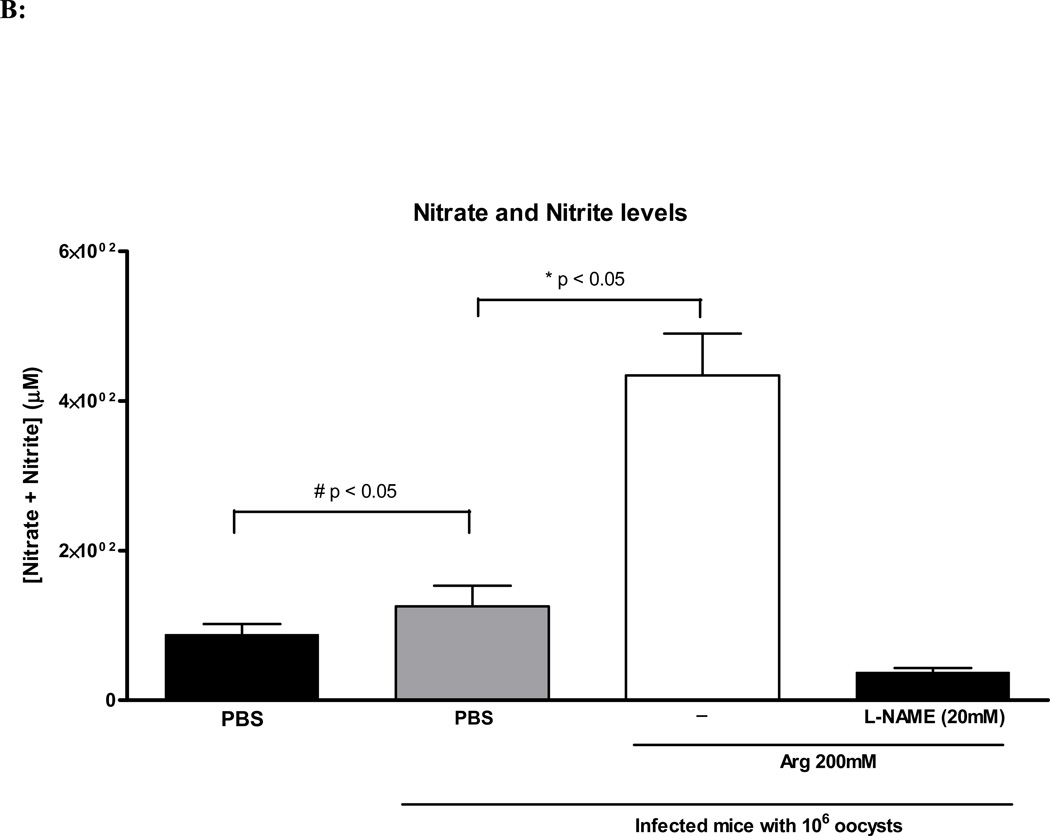
FIGURE 4.
(A) Quantification of fecal shedding from the harvested ileal tissue by real-time PCR at day 14 of age (day 8 of infection). Nourished infected controls (N=5); undernourished infected controls (N=7); undernourished infected mice treated with L-arginine 200 mM (N=6); undernourished infected mice treated with L-arginine 200 mM and the NOS inhibitor NG-nitroarginine methyl ester (L-NAME), at the dose of 20 mM (N=5). Statistical analyses were done using Student T test. The results are shown mean ± SEM and represent the average oocyst shedding from each mg of ileal tissue. (B) Nitrate and Nitrite colorimetric assay for ELISA absorbance at 550nm using an ELISA plate reader. Undernourished uninfected controls (N=4); undernourished infected controls (N=6); undernourished infected mice treated with L-arginine 200 mM (N=6); undernourished infected mice treated with L-arginine 200 mM and the NOS inhibitor NG-nitroarginine methyl ester (L-NAME), at the dose of 20 mM (N=5). Statistical analyses were done using Student T test. The results are shown mean ± SEM. Meaningful statistical difference was set at P < 0.05.


