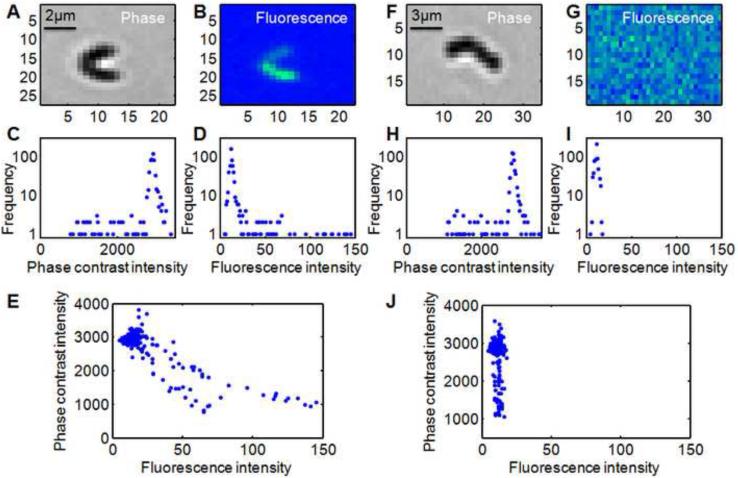
Figure 1.
Analysis of (A-E) reporter “on” and (F-J) reporter “off” clusters of a PcomX::gfp reporter strain of S.mutans at 20× magnification ([XIP]=36 nM). Panels C,H and D,I show the intensity histograms for the phase contrast and fluorescence images respectively. The sharp peak in each histogram results from the uniform background region that surrounds the cell cluster. Panels E and J show the phase-fluorescence scatter plots. Each point in the scatter plot shows the brightness of one pixel as it appears in the phase contrast and fluorescence images.

