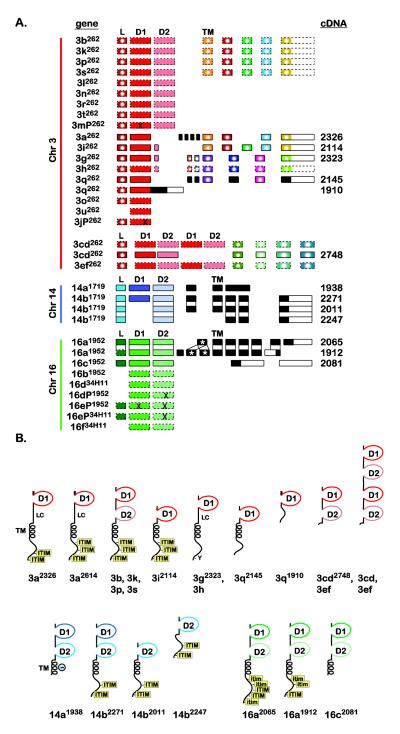
Fig. 2. DICP exon organization and predicted protein structures.
(A) DICP genes (Fig. 1) are listed on the left. cDNA identities (Supplemental Materials and Methods and Supplemental Fig. S3) are listed on the right. Exons are represented by rectangles and include: peptide leader (L), D1 domain (D1), D2 domain (D2) and transmembrane domain (TM). Unique exons are black. Similar exons are color coded. Exons that encode peptide sequences that are identical or differ by a single residue are color coded and marked by a white circle. The presence of a stop codon or frameshift within an exon is represented by “X”. Exons predicted from genomic sequence, without a corresponding cDNA, are bound by dashed lines. The dicp16a1912 transcript possesses a duplicated exon (see Supplemental Fig. S7 for details). (B) Schematic representation of DICPs deduced from both cDNAs and predicted genes. Structures directly based on cDNA sequences are indicated by a superscript allele number. D1 = D1 Ig domain; D2 = D2 Ig domain; TM = transmembrane region; LC = region of low sequence complexity; ϴ = negatively charged residue within a TM; ITIM = conventional ITIM and itim = ITIM variant.

