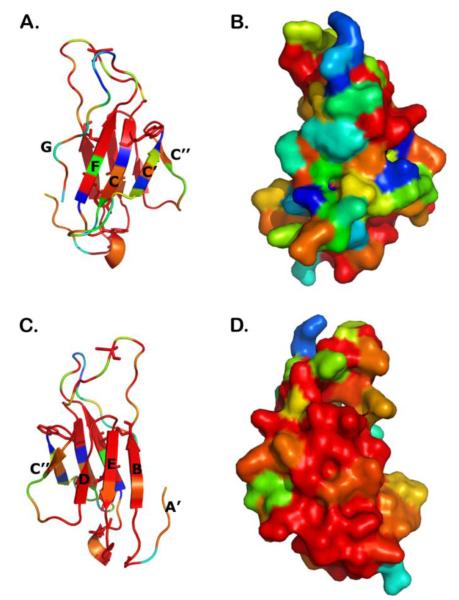
Fig. 4. Structural modeling of Dicp3f-D1, a predicted V-type Ig domain.
(A) A ribbon diagram of an atomic homology model of Dicp3f-D1 is shown in which color variation indicates sequence differences between Dicp3f-D1 and seven other DICP D1 sequences. Blosum62 similarity values are: <40, blue, 40-50, cyan, 50-60, green, 60-70, yellow, 70-90, orange and 90-100, red. (B) The front sheet (A’GFCC’C”) of Dicp3f is oriented towards the viewer, and depicts the solvent accessible surface. (C and D) The respective ribbon and surface prediction models for Dicp3f-D1, in which the highly conserved back sheet (ABED) is oriented towards the viewer, are shown. Protein sequence variability is confined to a single molecular surface.

