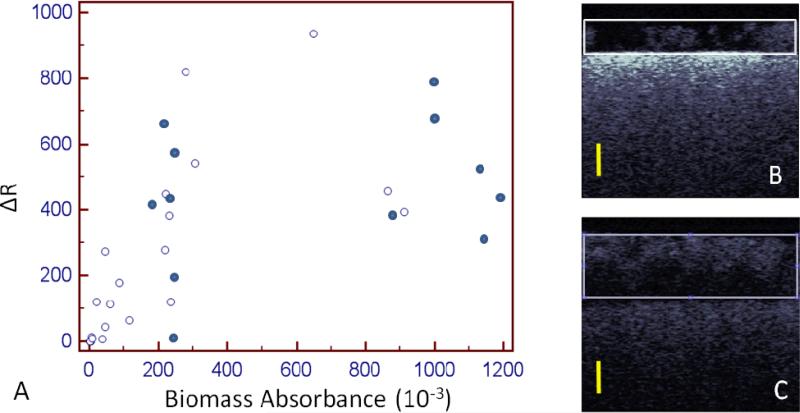
Figure 4.
Scatter plot of Cross-Polarization OCT analysis and crystal violet. Open circles denote time points from 24-52 hours. 6 samples at 24 hours were near zero for both analyses. Closed circles show the biofilm at 56 and 72 hours. At these later time points, the biofilm began (B) detaching or (C) growing to a thickness that attenuated the OCT signal in the deeper layers. The scale bars are 500 μm in optical depth or roughly ~385 μm in biofilm depth.

