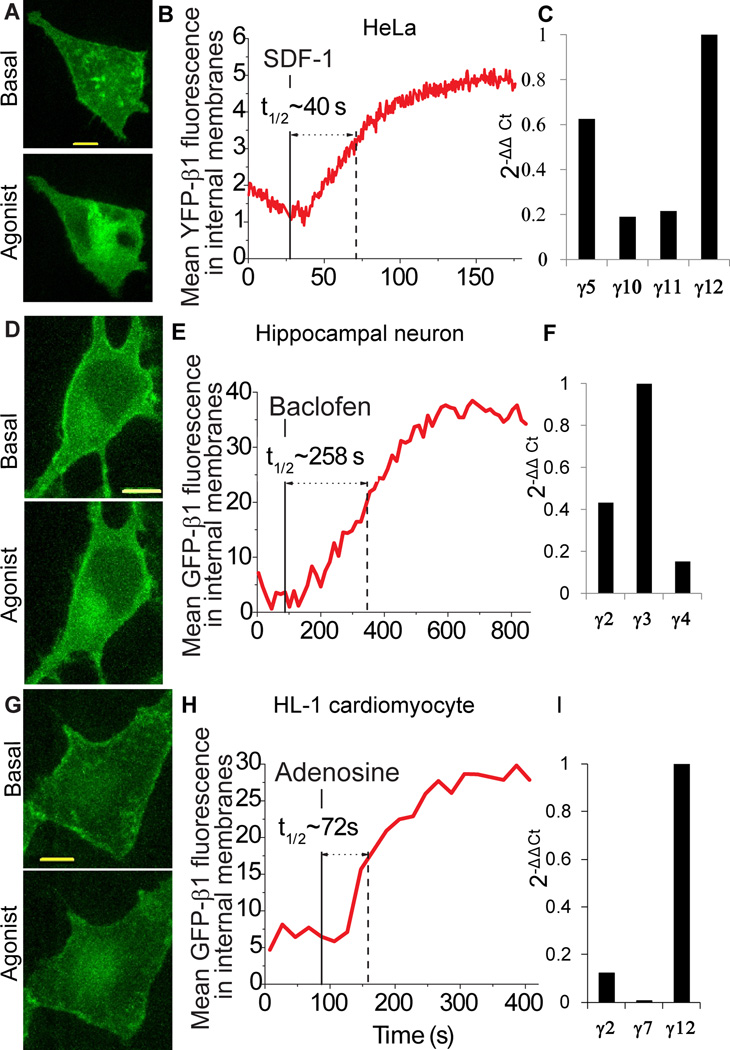
Fig.3. Endogenous γ subunits translocate in HeLa cells, hippocampal neurons and cardiomyocytes.
(A) Representative 3D images of HeLa cells expressing YFP-β1 before and after addition of SDF-1α (100 ng/ml) (n = 7). Image after agonist addition is representative of images where intensity in the intracellular membranes has reached maximum. B Representative plot showing the increase in internal membrane YFP fluorescence after receptor activation. C Quantitative real-time PCR profile of the most abundant γ subunit types in HeLa cells (D) Representative 3D images of rat hippocampal neurons expressing GFP-β1 before and after addition of baclofen. 6 day old neuronal cultures were transiently transfected with GFP-β1 and untagged αo. Cells were imaged before and after exposure to the GABA-B receptor agonist, baclofen (10 µM) (n = 20). Image after agonist addition is representative of images where intensity in the intracellular membranes has reached maximum. (E) Corresponding plot showing the increase in internal membrane GFP fluorescence after receptor activation. (F) Quantitative real-time PCR profile of major γ subunit types in neurons. (G) Representative 3D images of HL-1 cells expressing GFP-β1 before and after activation of endogenous Gi/o coupled Adenosine A1 receptor with 10 µM N6 cyclopentyladenosine (n=3). (H) Representative plot showing the increase in internal membrane GFP fluorescence after receptor activation. (I) Quantitative real-time PCR profile of major γ subunit types in HL-1 cells. Scale bars = 10 µm.

