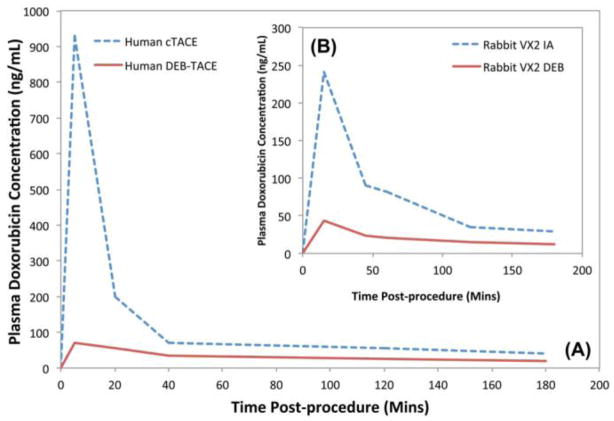
Figure 2.
Comparison of doxorubicin pharmacokinetic (PK) profile following conventional Lipiodol-based TACE (cTACE), intra-arterial infusion (IA) and DEB-TACE using doxorubicin. (A) Human plasma doxorubicin concentration. (B) Rabbit plasma doxorubicin concentration in a rabbit Vx-2 tumor model. Note the similarities between (A) and (B) indicating the useful predictive nature of the animal model for systemic drug levels obtained using DEBs. Direct comparison between cTACE in part A and IA in part B is not possible. From [44] with permission.

