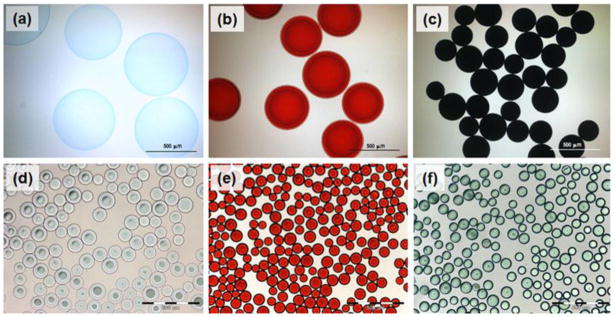
Figure 4.
Optical micrographs of DEBs. (a) Unloaded 500–700 μm DEB; (b) Doxorubicin (18.2 mg/mL) loaded 500–700 μm DEB; (c) Mitoxantrone (19.8 mg/mL) loaded 500–700 μm DEB. Note the effect of mono or divalent drug binding on bead size and the color imparted by the drug. (d) Unloaded DEB (70–150 μm); (e) Doxorubicin (37.5 mg/mL) loaded DEB (70–150 μm); (f) Irinotecan (50 mg/mL) loaded DEB (70–150 μm). Note that these DEBs (d, e and f) are much smaller than that used to conduct the early Phase I/II clinical studies with DEB (b).

