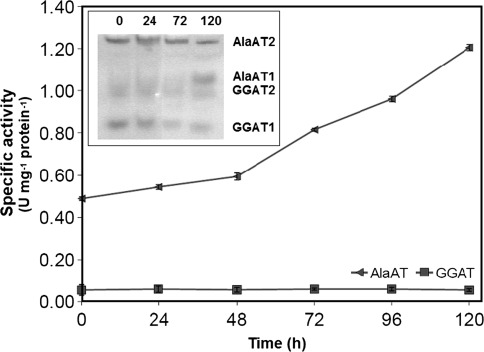
Fig. 6.
AlaAT and GGAT specific activities in roots of control wheat seedlings and seedlings harvested 24, 48, 72 and 120 h after induction of hypoxia. Changes in activity of individual AlaAT and GGAT revealed by activity staining are given in inset graph. Results are the mean of three replicates ± SD

