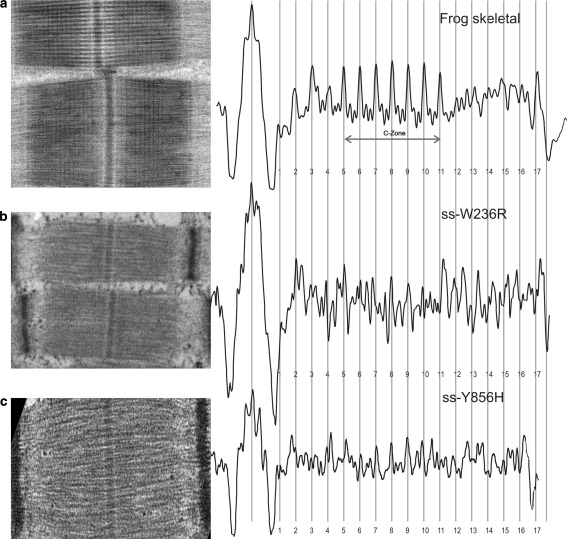
Fig. 5.
Averaged axial density profile plots of skeletal muscle with MYBPC1 mutations and control samples. The profile plot from a frog sartorius muscle is compared with the mean profile plots of b ss-W236R and c ss-Y856H. The left panel shows an example electron micrograph used to calculate the average profile plots in the right panel. The profile plots are aligned at the centre of the M-band and the edge of the A-band (green lines) and 17 red stripes of 43-nm spacing. a Reproduced from Luther et al. (2008) with permission from Elsevier. (Color figure online)

