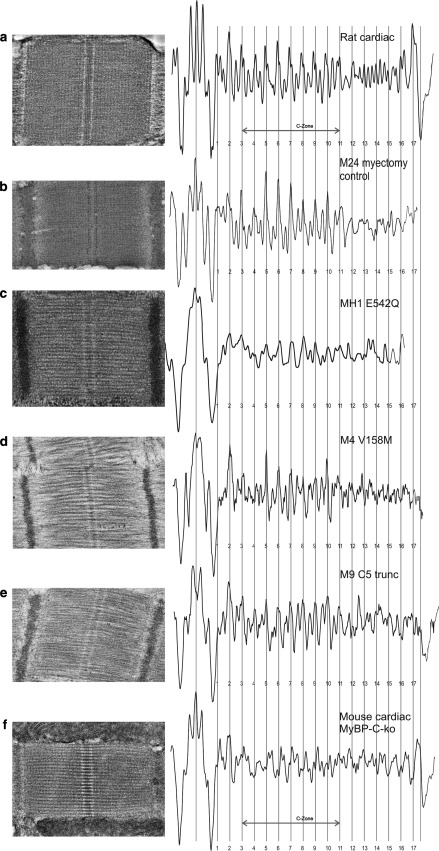
Fig. 6.
Averaged axial density plot profiles of the cardiac mutants and control samples. The profile plots are precisely lined up as described previously, along the centre of the M-band and the edge of the A-band. The 9 stripes due to cMyBP-C are labelled as the C-zone. a Profile plot derived from rat cardiac muscle (papillary) cryosections was compared with the average profile plot for the HCM myectomy samples: b M24 myectomy control sample; c MH1, d M4, e M9. Distinct and regular peaks can be observed in the C-zone of the cardiac mutant samples that coincide with the cMyBP-C axial spacing of 43 nm (red stripes). These plots were also compared with f mouse cMyBP-C-ko muscle cryosections. MyBP-C stripes are considerably suppressed in the cMyBP-C-ko muscle. a, f Reproduced from Luther et al. (2008) with permission from Elsevier. (Color figure online)

