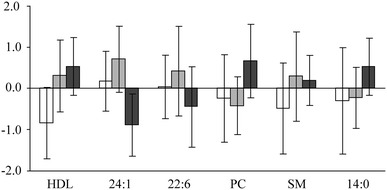
Fig. 5.

The profiles of the variable changes for the WC (white), DC (light grey), and HPC (dark grey) groups. The values are expressed as standard deviation units from the mean of the whole study population. 24:1 nervonic acid, 22:6 docosahexaenoic acid, PC phosphatidylcholine, SM sphingomyelin, 14:0 myristic acid
