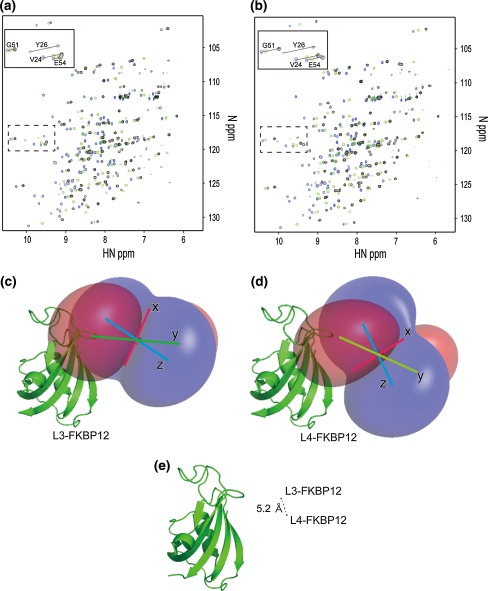
Fig. 2.
Overlay of the 1H–15N HSQC spectra of L3-FKBP12 (a) and L4-FKBP12 (b) in the presence of one equivalent molar Lu3+ (blue), Dy3+ (green) and Tb3+ (black). Graphical views of the PCS isosurface of Dy3+ for L3-FKBP12 (c) and L4-FKBP12 (d). Positive and negative PCS values are indicated by blue and red, respectively. e Metal positions of L3- and L4-FKBP12. Metal positions are shown in ball (red for L3 and blue for L4)

