
Fig. 1.
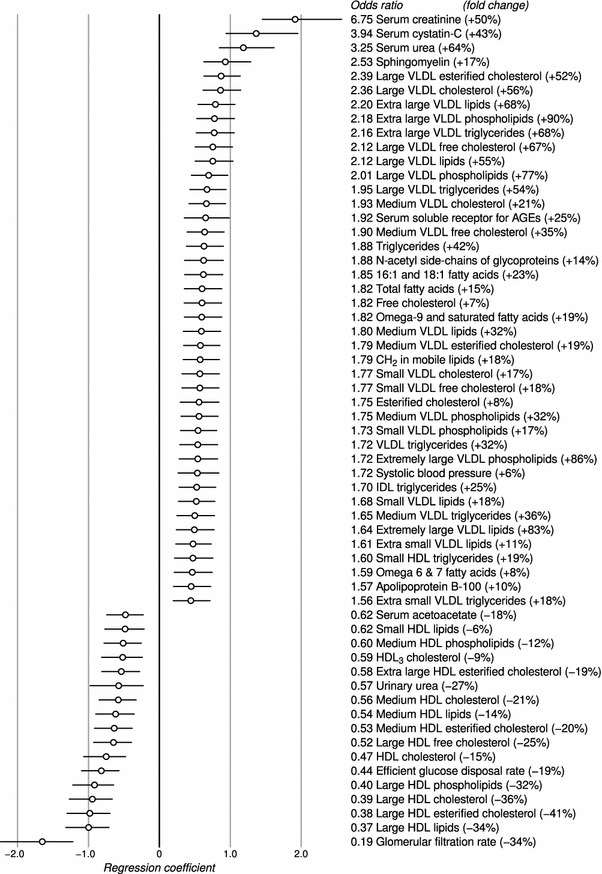
Odds ratios for diabetic kidney disease, adjusted by diabetes duration, age and gender. The circles indicate logarithmic ORs (regression coefficients in the logistic model) and the horizontal lines show the 95% interval. The fold change was calculated by dividing the median concentration difference (after adjustments) between the cases and controls by the median concentration in the control group. Only those variables that reached Bonferroni multiple testing significance are included (P < 0.00038)