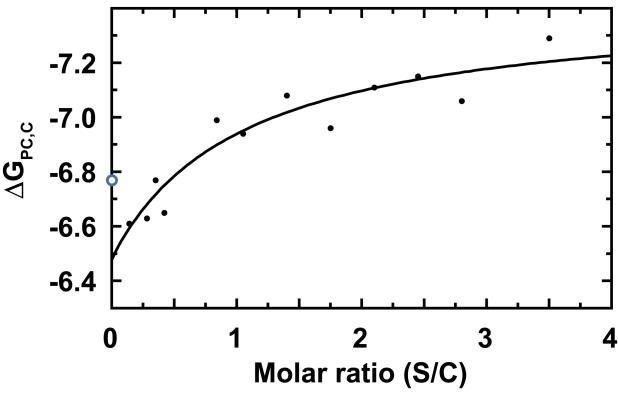
Figure 1. Scaffolding protein increases PC stability.
ΔGPC_w/out_S becomes stronger at higher relative concentrations of scaffolding protein. The hyperbolic curve fit indicates each scaffolding protein contributes −1.30 ± 0.24 kcal/mol to a base PC stability of −6.45 ± 0.11 kcal/mol per coat protein. The midpoint of the binding fit is S/C = 0.88. Note that the ΔGPC_w/out_S for 0 scaffolding protein is −6.77 kcal/mol, (blue, open circle) calculated from the critical concentration for uncontrolled coat protein assembly (Figure 2) and is not included in the curve fit. This graph includes new data, and data from (Parent, Zlotnick, and Teschke, 2006).

