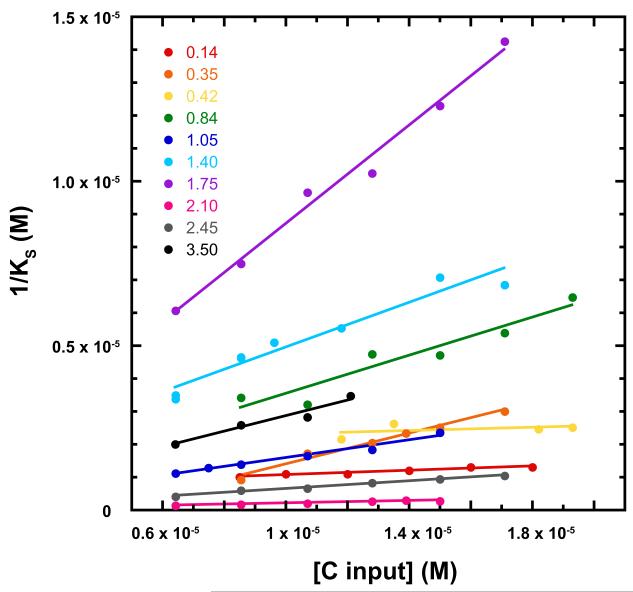
Figure 3. The affinity of scaffolding protein for the PC lattice becomes weaker at higher initial concentrations of coat protein.
Each line represents data for assembly reactions with a given S/C molar ratio from 0.14 to 3.5; points are at different initial concentrations of coat protein. The monotonic change in KS is consistent with two or more classes of binding sites or negative cooperativity. The graph includes new data and data from (Parent, Zlotnick, and Teschke, 2006). The KS values in this graph were calculated for 300 scaffolding protein sites; the graph was qualitatively identical for 360 and 420 sites.

