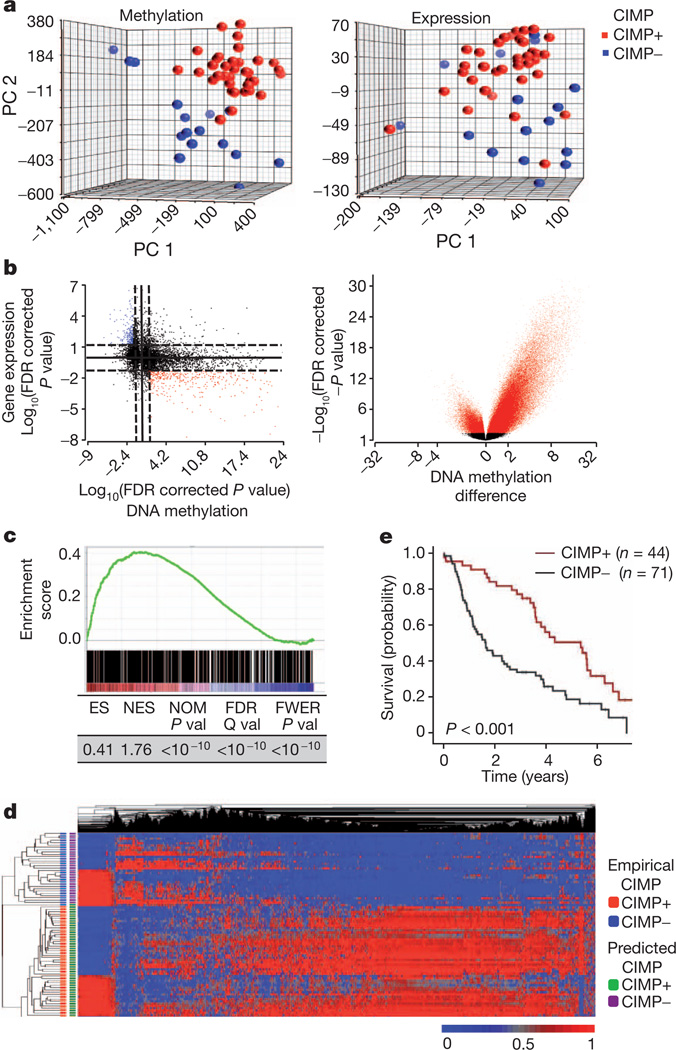
Figure 3. IDH1 mutation directly generates the methylation patterns present in G-CIMP tumours.
a, The methylomes and transcriptomes of LGGs are distinct. PCA plot of LGG tumours for all methylation probes (left) and expression probes (right) (n = 52). PC, principal component. b, Starburst plot (left) for comparison of DNA methylation and gene expression. The log10 (FDR-corrected P value) is plotted for β value forDNAmethylation (x axis) and gene expression (y axis) for each gene. Black dotted line shows the FDR-adjusted P value of 0.05. Red points indicate downregulated and hypermethylated genes in G-CIMP+ LGGs versus G-CIMP− LGGs. Blue points show hypomethylated and upregulated genes. Volcano (right) plot of all CpG loci analysed for G-CIMP association. The β-value difference in DNA methylation between G-CIMP+ and G-CIMP− tumours is plotted along the x axis. The P value between G-CIMP+ and G-CIMP− tumours is plotted on the y axis (−log10 scale). Red indicates significantly different probes. c, Concordance between hypermethylated sites in mutant IDH1-expressing astrocytes and G-CIMP+ LGGs. GSEA shows significant enrichment between 730 hypermethylated unique CpG sites identified in IDH1 mutant astrocytes (ANOVA between passage 2 and 40) and those present in G-CIMP+ gliomas. GSEA correlation shown in colour scale. ES, enrichment score; FDR, false discovery rate; FEWR, familywise error rate; NES, normalized enrichment score; NOM, nominal P value. d, Differential methylation in IDH mutant astrocytes correctly classifies G-CIMP in the human LGGs. Two-dimensional-unsupervised hierarchical clustering of 81 human gliomas with top variant probes (n = 10,000) frommutant IDH1 astrocytes. Tumours are shown on the y axis, probes along the x axis. Methylation (β value) for each probe is represented with the colour scale. G-CIMP classification as determined by the astrocyte-derived data is denoted by the colour bars at the left. e, Kaplan–Meier survival curve of 115 patients with grade II or grade III gliomas in the Rembrandt Database grouped by CIMP status. P value calculated by log rank.

