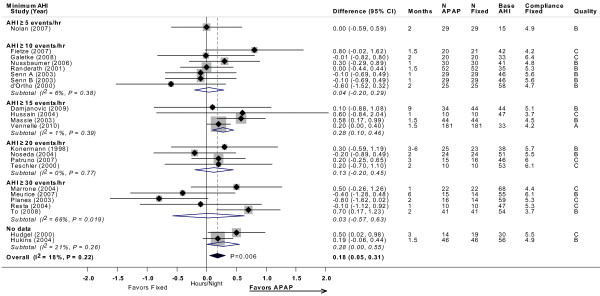
Figure 2.
CPAP compliance (hour/night) with APAP versus fixed CPAP: meta-analysis, with subgroup analyses by minimum AHI threshold. Estimates and 95% CIs by study subgrouped by minimum AHI threshold used in each study. The overall random effects model meta-analysis is displayed by the black diamond, which spans the width of the 95% CI. Each subgroup meta-analysis, by AHI threshold, is shown by the open diamonds. Grey boxes are proportional to the weight of each study in the overall meta-analysis. For each meta-analysis the I2 statistic and the P value for heterogeneity is displayed. The P value for the summary estimate is displayed next to the black diamond. Note that studies favoring APAP are to the right of the vertical 0 line. Base AHI: baseline apnea-hypopnea index (events/hour) in fixed CPAP group; compliance fixed: compliance (hour/night) in fixed CPAP group; fixed: fixed CPAP.

