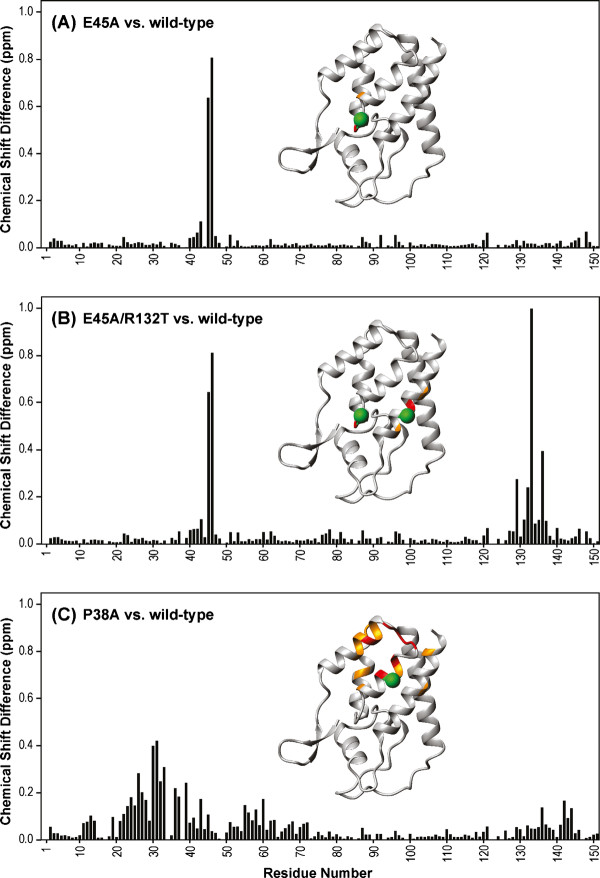
Figure 6.
Amide chemical shift differences between the wild type and E45A, E45A/R132T and P38A mutant CA-NTD proteins. Combined 1H, 15 N chemical shift differences between wild-type and mutants E45A (A), E45A/R132T (B) and P38A (C) are plotted versus residue number. Structural mapping of the chemical shift differences onto the X-ray structure of CA-NTD [1AK4] in ribbon representation is provided in the inset. The locations of the mutation sites are marked with large green spheres. Positions of residues whose amide resonances exhibit significant chemical shift differences are color-coded according to the magnitude of the change: red, Δδ > (Δδaverage + 2 × SD); orange, (Δδaverage + 2 × SD) > Δδ > (Δδaverage + 1xSD).

