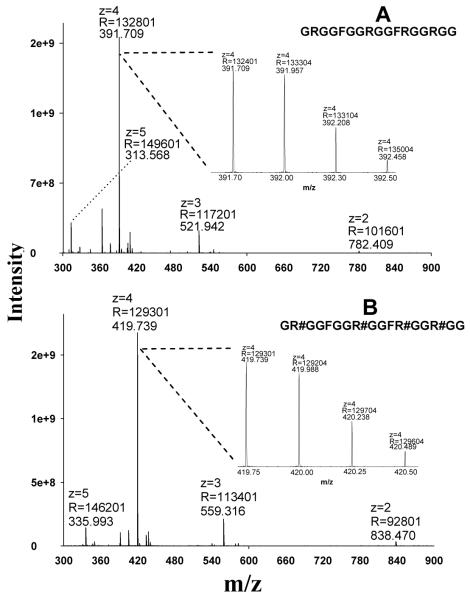
Fig. 1.
The charge state distributions of the GAR peptides under positive ESI, as obtained using an Orbitrap analyzer. (A) The MS1 spectrum of the unmodified peptide GRGGFGGRGGFRGGRGG; (B) the MS1 spectrum of the per-aDMA peptide GR#GGFGGR#GGFR#GGR#GG, where #=aDMA. Abbreviations: z, charge state; R, resolution.

