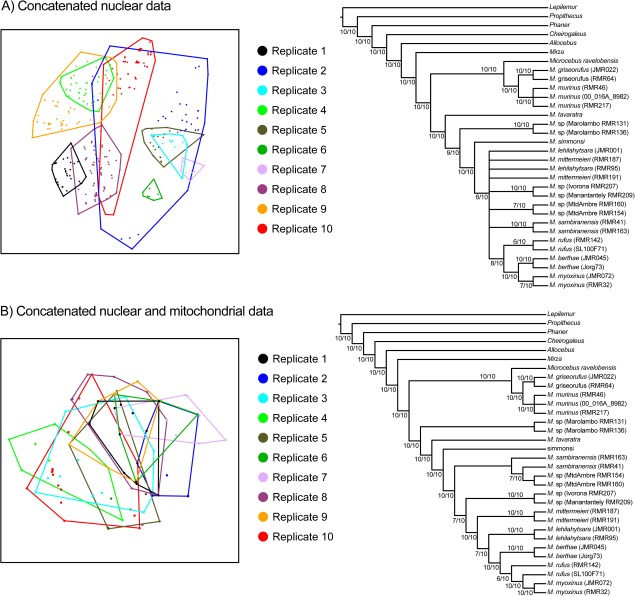
FIG. 4.
Different representations of the variance in cheirogaleid concatenated phylogenetic reconstruction that occurred when different alleles were sampled from an individual. Two-dimensional visualization of tree space using MDS of unweighted RF distances between trees are presented for (A) trees sampled from the posterior distributions of the ten replicate nuclear concatenated data sets and (B) trees sampled from the posterior distributions of the ten replicate nuclear + mitochondrial concatenated data sets. In both plots, minimum convex polygons encompass individual posterior distribution of trees. Corresponding majority-rule consensus trees (using a 50% minimum threshold) are presented to the right of each ordination plot. These consensus trees were reconstructed from the ten replicate consensus trees of each data source. Numbers on branches represent the number of times a branch was present.

