
Figure 4.
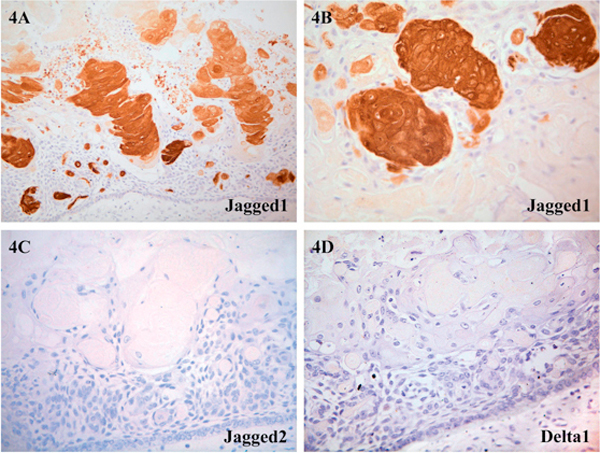
Photomicrograph of CCOT lining epithelium and ghost cells demonstrating distribution of Notch ligand proteins: A and B, Jagged1: strong expression in CCOT ghost cells and mildly in squamous transitory cells and tumoral epithelium (A, ×100; B, ×200); C, Jagged2: no immunoreactivity was detected (×200); D, Delta1: no immunoreactivity was detected (×200).