
Figure 1.
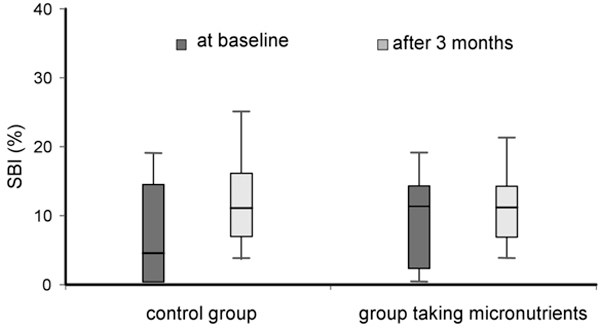
Inflammatory status of the gingiva (sulcular bleeding index, SBI) in the control group (n = 20) and the micronutrient group (n = 19) at baseline and after 3 months. Also shown are median, minima and maxima.
Official websites use .gov
A
.gov website belongs to an official
government organization in the United States.
Secure .gov websites use HTTPS
A lock (
) or https:// means you've safely
connected to the .gov website. Share sensitive
information only on official, secure websites.
Inflammatory status of the gingiva (sulcular bleeding index, SBI) in the control group (n = 20) and the micronutrient group (n = 19) at baseline and after 3 months. Also shown are median, minima and maxima.