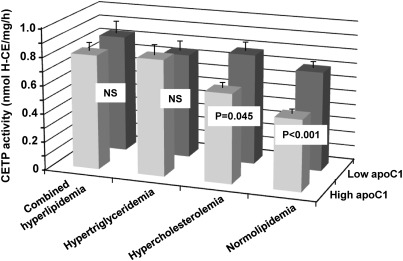
Fig. 2.
Diagonal stratification of CETP activity according to apoC1 and the presence or the absence of dyslipidemia. Subgroups were constituted by distinguishing between patients with normolipidemia (LDL-C and TG levels below 2.6 mmol/l and 1.7 mmol/l, respectively; n = 101), hypercholesterolemia (LDL-C levels above 2.6 mmol/l; n = 63), hypertriglyceridemia (TG levels above 1.7 mmol/l; n = 34), or combined hyperlipidemia (LDL-C and TG levels respectively above 2.6 mmol/l and 1.7 mmol/l; n = 42). Low and high levels of apoC1 mass were on both sides of the median value (50.6 mg/l). Vertical bars show mean ± SEM. Mean differences between low and high apoC1 groups were tested by unpaired t-test.

