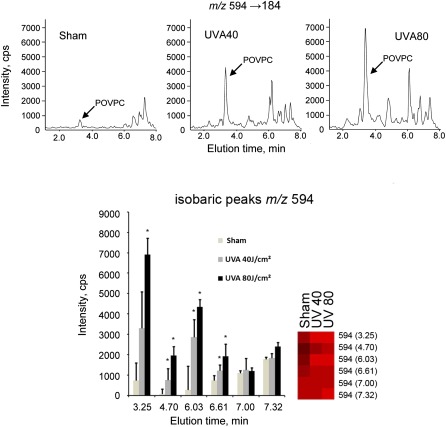
Fig. 6.
Differential regulation of isobaric peaks by UVA-irradiation. The data show that at certain m/z values (represented by m/z 594 in this Figure) only a proportion of peaks were up-regulated by UVA-irradiation, while other peaks were not significantly changed. Representative chromatographic profiles (upper panel) or mean values presented as bar graph or heat map (lower panel). Error bars indicate standard deviations of analytical triplicates (corresponding to six biological replicates). Asterisks indicate significant increase of UVA irradiated as compared with sham-treated cells (t-test, Benjamini-Hochberg adjusted to false discovery rate of 0.05).

