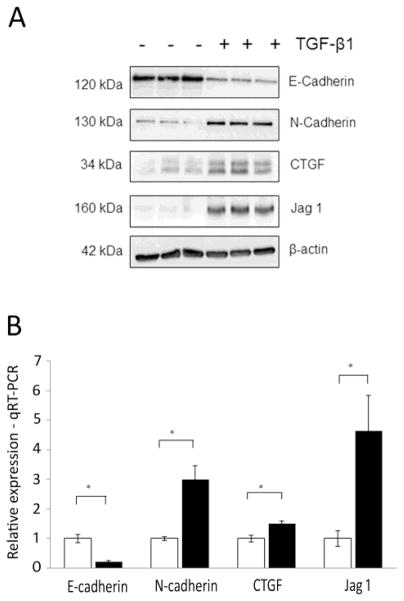
Fig. 1.
Establishment of fibrotic phenotype in human proximal tubular epithelial cells. (A) Western blot of markers of fibrosis (E-cadherin, N-cadherin) and TGF-β1 signaling (CTGF, Jagged1) in HK-2 cells stimulated with TGF-β1 (5ng/ml) for 48hr versus unstimulated controls (n = 3). (B) Real-time quantitative PCR validation of differentially expressed transcripts from RNA-Seq experiment. Quantitative TaqMan PCR was performed in unstimulated HK-2 cells (grey bar) and HK-2s stimulated with TGF-β1 (black bars). Expression was normalized to 18S. Data are plotted as mean ± SE. *P < 0.05, Student’s unpaired t test, n = 3 per group.

