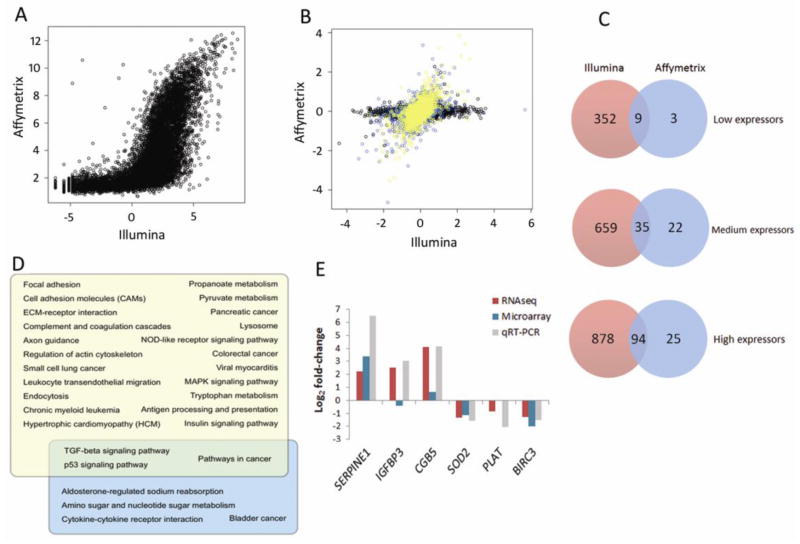
Fig. 4.
Comparison of RNA-Seq to microarray of TGF-β1 effects on gene expression in HK-2 cell line. (A) Raw signal comparison. In left panel, mean RNA-Seq RPKM of each gene is compared to expression level on the microarray (calculated from hybridization intensity). (B) Comparison of log FC of each gene from RNA-Seq to microarray. Genes were classified as high (yellow), medium (blue), or low (black) expressors, based on RNA-Seq RPKM for each gene. (C) Degree of overlap of differentially expressed genes from RNA-Seq and microarray, subdivided by expression level (RNA-Seq RPKM value; microarray hybridization intensity). (D) Overlap of significantly regulated KEGG pathways from RNA-Seq (yellow) and microarray (blue). (E) Log-fold changes of six selected genes in RNA-Seq (purple bar), microarray (blue bar) and corresponding quantitative TaqMan PCR validation (grey) in HK-2s stimulated with TGF-β1 (5ng/ml; 48hr). Expression was normalized to 18S. Data are plotted as mean ± SE. *P < 0.05, Student’s unpaired t test, n = 3 per group.

