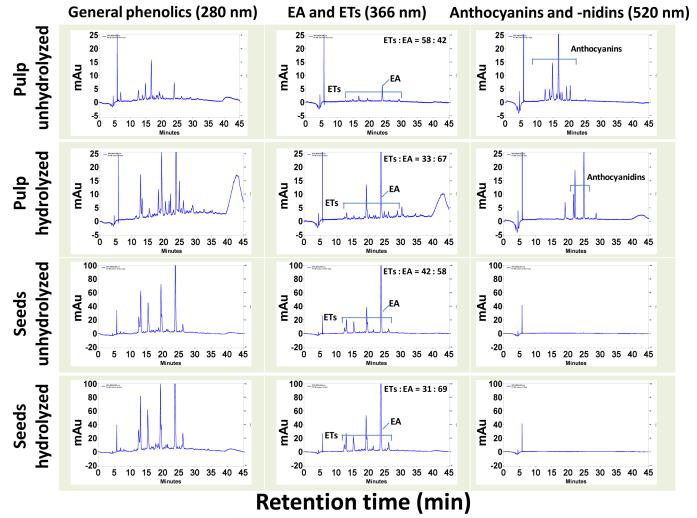
Figure 3.
HPLC profile of jamun pulp and seeds (hydrolyzed and unhydrolyzed) extracts. Twenty μl of enriched extracts (1 mg/ml) were injected and analyzed using photo diodarray detector on a C18 (250×4.6 mm ID x 5 μm) reverse phase column in a gradient of 3.5% aqueous phosphoric acid and acetonitrile. Chromatograms in the first column represent various polyphenolics detected at 280 nm. Chromatograms in the second column represent ellagitannins (ETs) and free ellagic acid (EA) monitored at 366 nm. Chromatograms in the last column show anthocyanins and anthocyanidins. mAu, milliabsorbance units. For clarity of data y-axis scales are different.

