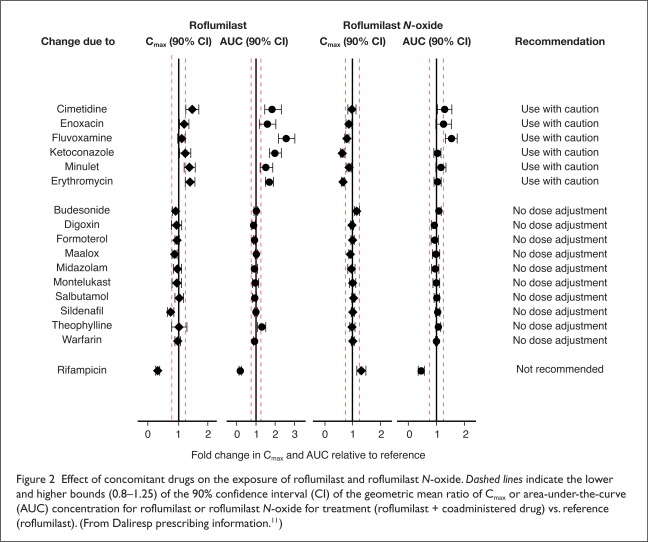
Figure 2.
Effect of concomitant drugs on the exposure of roflumilast and roflumilast N-oxide. Dashed lines indicate the lower and higher bounds (0.8–1.25) of the 90% confidence interval (CI) of the geometric mean ratio of Cmax or area-under-the-curve (AUC) concentration for roflumilast or roflumilast N-oxide for treatment (roflumilast + coadministered drug) vs. reference (roflumilast). (From Daliresp prescribing information.11)

