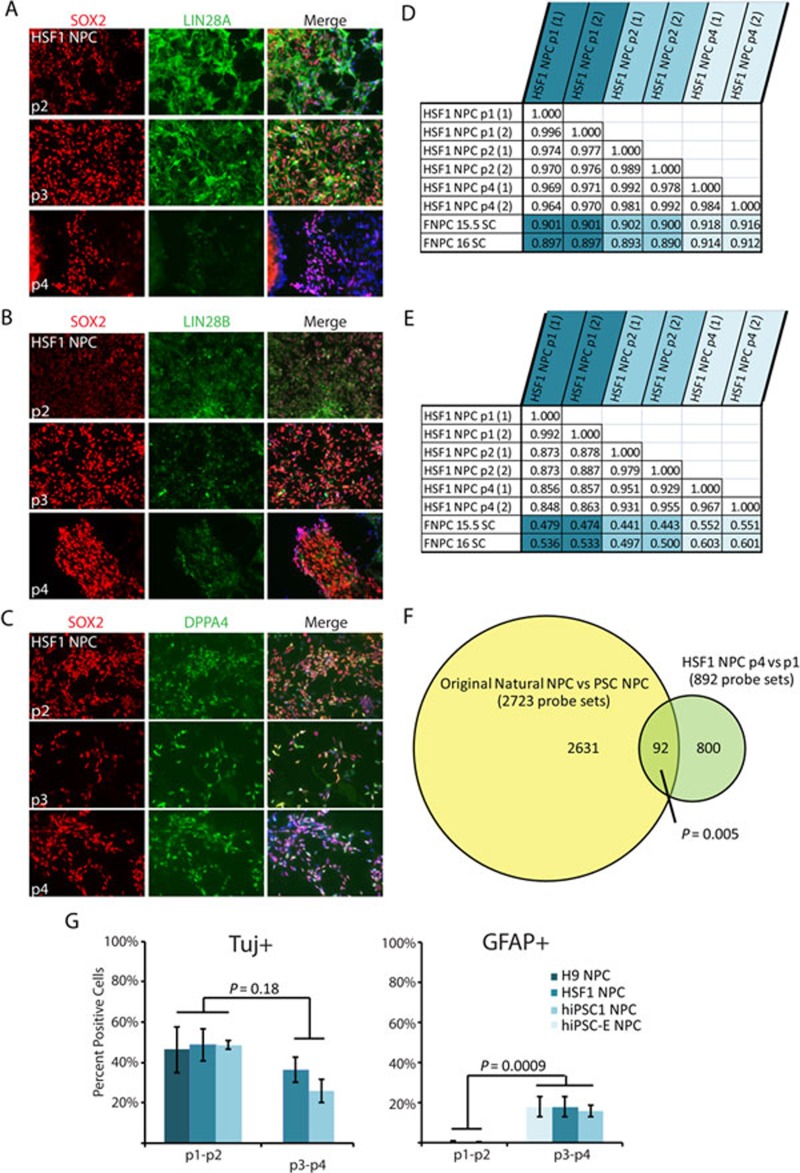
Figure 6.
Continued passaging of PSC-NPCs reduces LIN28 expression and corrects a small portion of the gene expression discrepancies. (A-C) Immunofluorescence staining of HSF1-derived NPCs over four passages. Each passage represents ∼5-7 days in culture. (D) Pearson correlation comparing global gene expression between HSF1 NPCs over several passages and NPCs derived from 16-week-old fetal spinal cord. (E) Pearson correlation including only those probe sets identified as different between PSC-NPC and Nat-NPCs (analysis from Figure 3A). (F) Venn diagram demonstrating the original differences identified in Figure 3A overlap significantly with gene expression differences between p1 and p4 PSC-NPCs (t-test P < 0.01; fold change ≥ 1.54). Direction of differential expression was taken into account. Statistical analysis performed by hypergeometric distribution. Note: later analyses were performed by normalizing and filtering only samples of the neural lineage. As a result the original 2 769 probe sets identified by analysis in Figure 3A were reduced to 2 723. (G) Percent of PSC-NPCs at the indicated passage undergoing neuronal (Tuj1) or glial (GFAP) differentiation following 3 weeks of differentiation.

