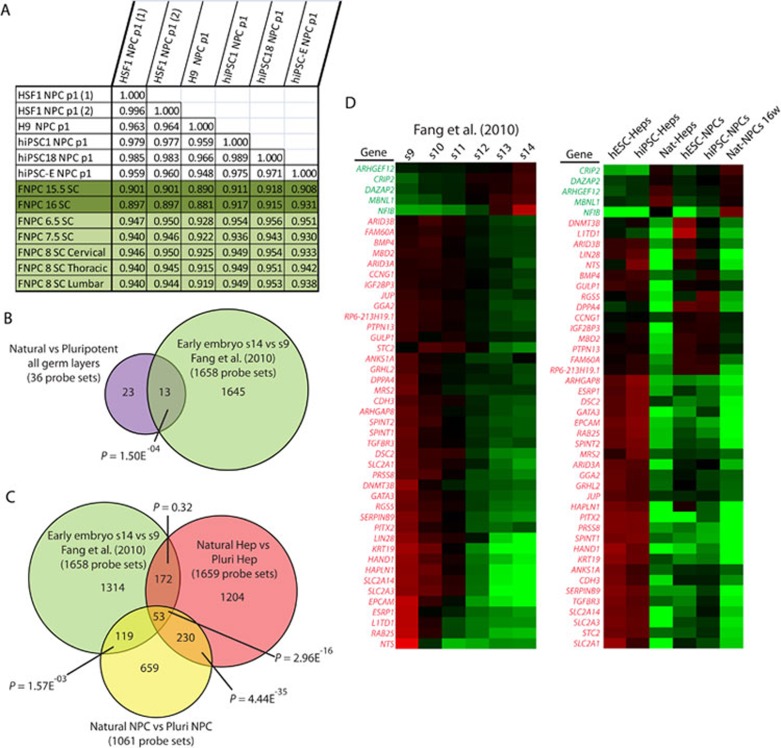
Figure 7.
Evidence that PSC derivatives reflect cell types found prior to 6 weeks of development. (A) Pearson correlation comparing global gene expression between PSC-NPCs and fetal spinal cord NPCs. (B) Comparison of the original probe sets identified as different between PSC derivatives and their natural counterpart (Figure 3A) and those differentially expressed between stage 9 and stage 14 embryos (Fang et al. 42, t-test P < 0.01, fold change ≥ 1.54). (C) Venn diagram comparing the probe sets different between PSC derivatives and their tissue-derived counterparts for the Hep and NPC lineages and those differentially expressed between stage 9 and stage 14 embryos. (D) Heat maps generated for the 46 unique genes represented by the 53 probe sets shown in C. Left, samples include the six stages of embryonic development represented in Fang et al. 42. Right, samples include PSC-derived NPCs and Heps and their respective natural counterparts. Green probe sets represent those genes upregulated over the course of development, while red probe sets are those downregulated over the course of development.

