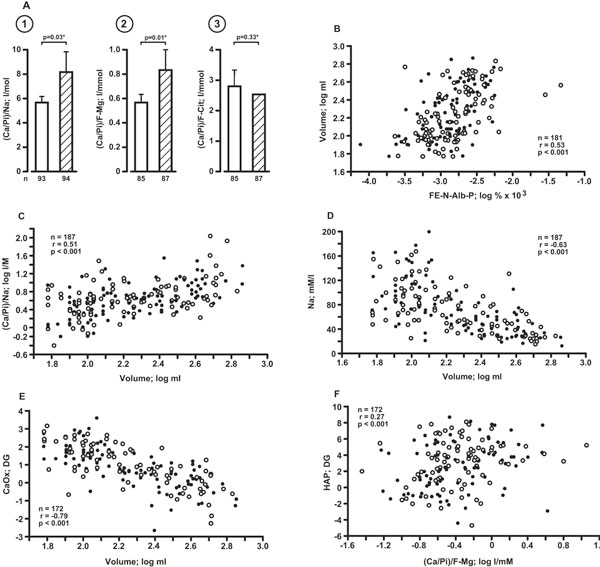
Figure 1.

A: Ca/Pi ratio in fasting 2 h urine as influenced by the prevailing concentration of Na (➀), F-Mg (➁)and F-Cit(➂); light and hatched columns are patients with urine pH ≤6.14 and > 6.14, respectively; n: number of patients; *: based on log data. Mean values and (bars) SEM. B - F: Variables correlating with urinary volume (B-E) and HAP DG, respectively; note that negative values of DG (CaOx, HAP) indicate solubility of the Ca salt under study [32], and that segregation of SF (filled circles) and SB (open circles) patients is not recognizable.
