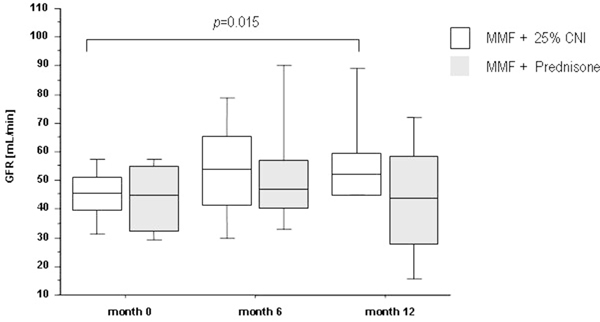
Figure 2.

GFR measured by 99m-Tc-DTPA-Clearance at study inclusion and months 6 and 12 after conversion to MMF therapy. Data are given as box plots, where the limits of the boxes indicate the 25th and 75th percentiles and the lines inside the boxes indicate the 50th (median) percentile. The whiskers indicate the 10th and 90th percentiles.
