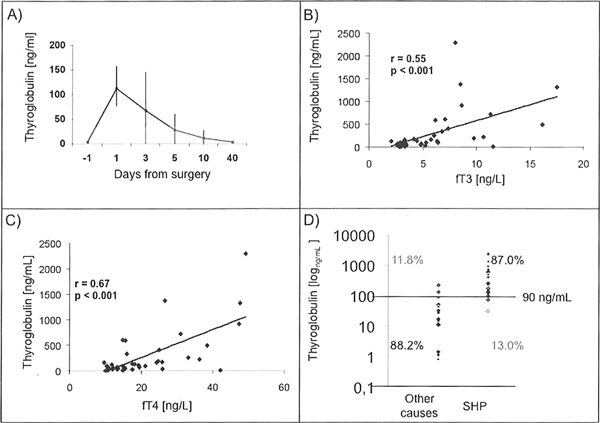
Figure 3.

A) Time course of Tg in [ng/mL] in all patients undergoing parathyroidal surgery (n = 39); the light grey box marks the normal range of Tg (up to 30 ng/L); Mean value ± s.e.m. are shown. B) Correladon of Tg with free triiodothyronine is given (r = 0.55; p < 0.001). C) Correlation of Tg with free thyroxine is given (r = 0.67; p < 0.001). D) Distribution of Tg values of hyperthyroid patients after SHP surgery and patients with hyperthyroidism due to other causes of hyperthyroidism are displayed. Using a cut-off of 90 ng/mL gives a good diagnosdc sensitivity and specificity. Values outlying the cut-off and their corresponding rates are highlighted in grey.
