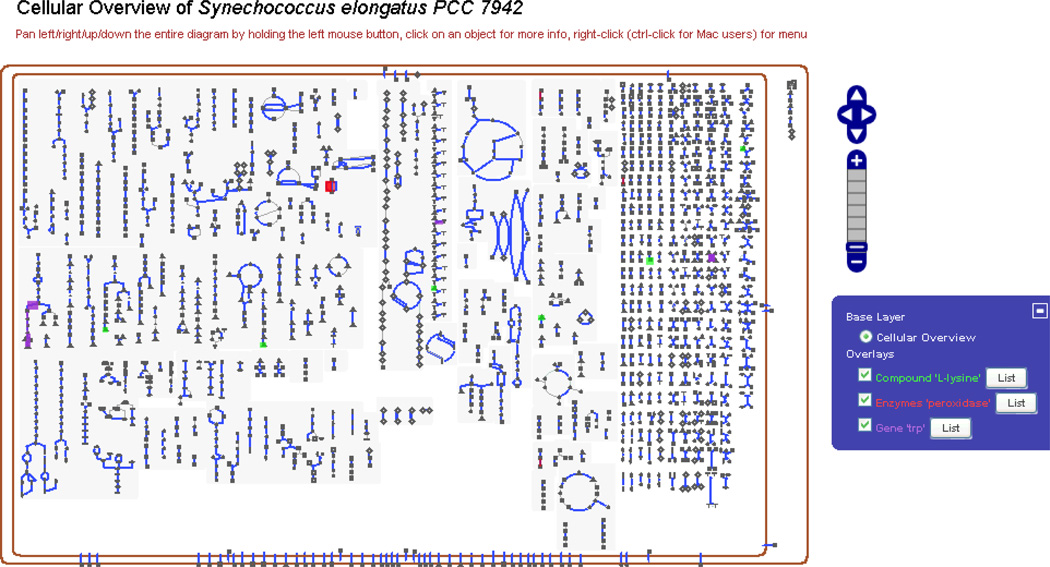
Figure 8.
The Cellular Overview. The figure shows the Cellular Overview for the cyanobacterium Synechococcus elongatus PCC 7942. Detailed description of the diagram is provided in the text. Several items have been highlighted on this diagram – the compound L-lysine (in green), peroxidase enzymes (in red), and genes whose name contain the substring “trp” (purple). The switchboard, to the right of the image, enables turning the individual highlighting operations on and off.

