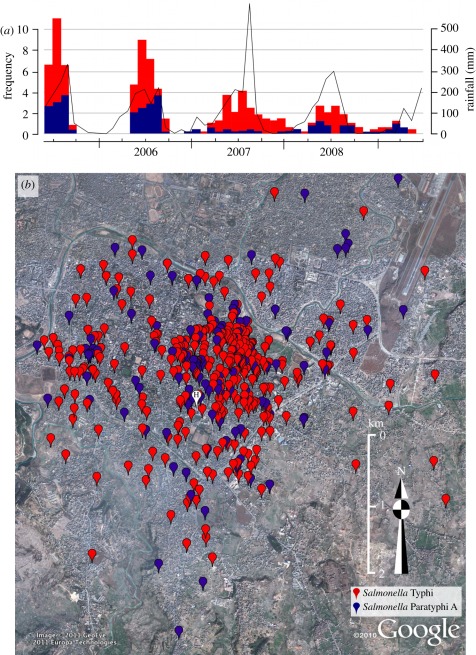
Figure 1.
The temporal and spatial distribution of typhoid infections. (a) Histogram showing the monthly temporal distribution of S. Typhi (red) and S. Paratyphi A (blue), and the corresponding monthly rainfall over the 4-year study period. (b) Google Earth map, of the study site showing locations of the residences of 584 culture-confirmed typhoid patients: 431 S. Typhi (red) and 153 S. Paratyphi A (blue). The site of patient enrolment (Patan Hospital) is marked H.

