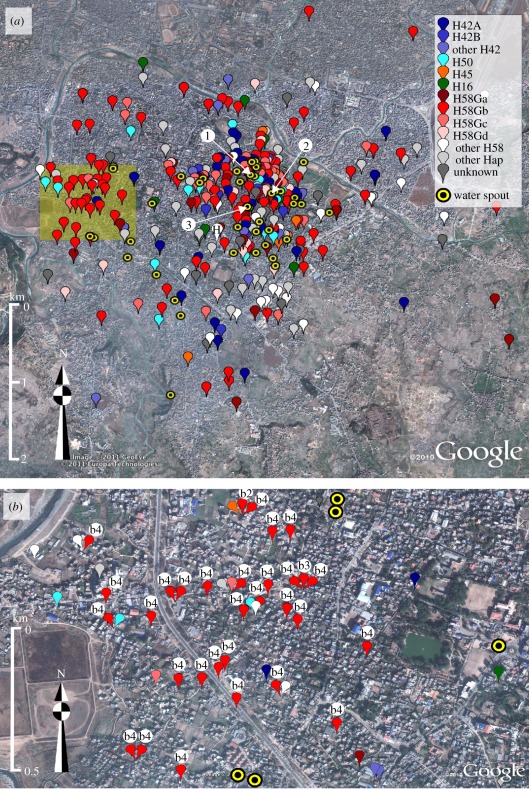
Figure 4.
The spatial distribution of S. Typhi genotypes. Google Earth maps of the study site showing locations of the residences of culture-confirmed S. Typhi infections, categorized by S. Typhi genotype (defined in figure 3) and the 42 functional water spouts including the three water-sampling sites (labelled 1, 2 and 3), according to the legend provided. (a) All 431 culture-confirmed S. Typhi infections from the 4-year study period. The site of patient enrolment is marked H. (b) Culture-confirmed S. Typhi infections occurring in a concentrated 1 km2 cluster to the west of the hospital (shaded as in (a)). The subgroups of the H58Gb are shown by the lower-case letters and numerals associated with red markers.

