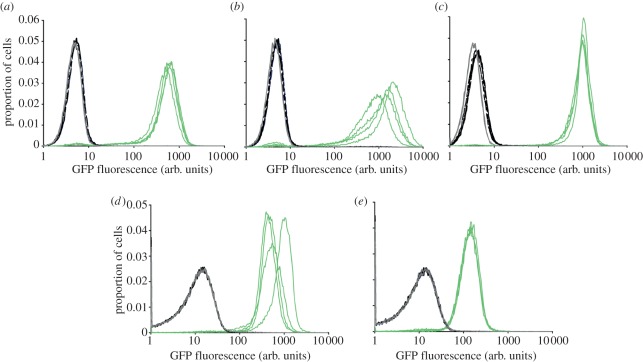
Figure 3.
Comparison of inducible transgene expression between cell lines. In each case, four independent clones of pDex-777-containing cell lines were induced for 24 h. Flow cytometry measurements using identical settings were performed on induced (green lines) and non-induced (black lines) parental non-transfected clones (grey lines). (a) SmOxP427. (b) SmOxP927. (c) 29 : 13. (d) SmOxB427. (e) S16.

