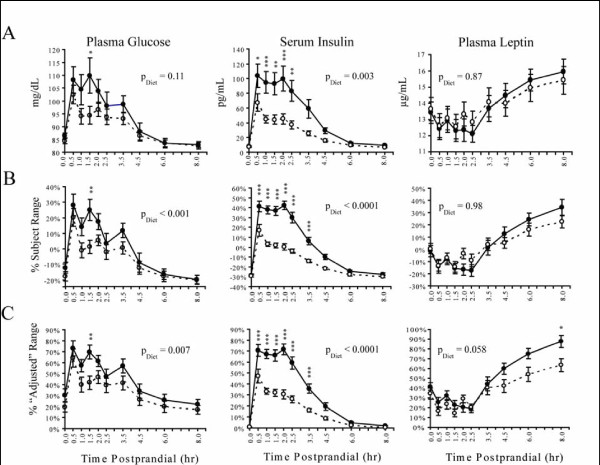
Figure 1.
Concentrations of glucose, insulin, and leptin measured at fasting and postprandial time points after a high GI (●) and low GI (○) challenge. Performing a diet × time two-way ANOVA of the raw data (Panel A) showed significant diet-dependent differences in insulin (p = 0.003) but not glucose or leptin responses. Range scaling the data (Panel B) significantly reduced the variance at all-time points (p < 0.05, F-test). Adjusting the data by each individual's daily nadir prior to scaling to the subjects experimental HGI range corrected for additional inter-individual variability (Panel C). This "nadir-adjusted" range scaling procedure had little to no effect on assessment of insulin responses, but suggests a diet-dependent difference glucose (p = 0.007) and leptin response (p = 0.058). All results are means ± SEM. Time points showing significant differences in Bonferroni's post-hoc analyses are indicated at p < 0.05 (*), p < 0.01 (**), and p < 0.001 (***).

