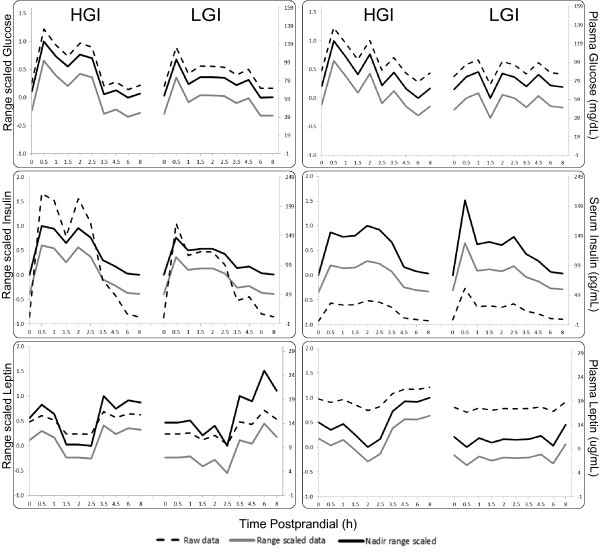
Figure 2.
Data from two randomly chosen subjects illustrating raw, conventional range scaled and nadir-adjust range scaled data for glucose (top), insulin (middle), and leptin (bottom). Scale for the raw data is on the right, and scale for the two sets of transformed data is on the left. Note that the trend in data is preserved by the transformations.

