
Figure 3.
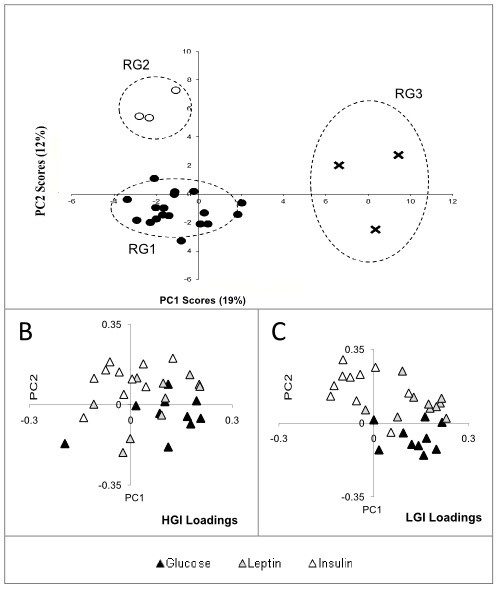
Panel 'A' is the PCA scores plot of range-scaled HGI and LGI at all time-points for glucose, insulin and leptin responses. PC1 (x-axis) and PC2 (y-axis) represent 19% and 12% of the total variance in the dataset. While the majority of subjects (n = 18) fall into Metabolic Group 1- RG1 (●), the subjects indicated using (○) Response Group 2- RG2 and (x) Response Group 3- RG3 are two distinct groups of subjects that exhibit responses different from RG1. The circles around the RG groups indicate mean ± 2xSD limits. Panel 'B' and 'C' are the loadings plot that correspond to panel 'A' and indicates that the LGI responses are more variant than HGI, and also that while insulin dictates the separation of subjects in one direction (top left quadrant), glucose and leptin appear to be the most variable responses in another direction (top and bottom right quadrants).