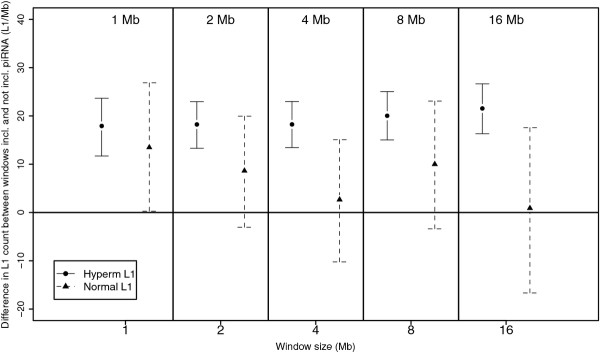
Figure 3.
Difference in LINE-1 counts between genome windows including piRNA clusters and windows not including piRNA clusters for genome windows of 0.5-16 Mb. Shown is the absolute difference in mean LINE-1 elements per window both for hypermethylated LINE-1 elements (circles, whole lines) and normally methylated LINE-1 elements (triangles, broken lines). Bars represent 95% confidence intervals evaluated by calculating a bootstrap estimates of the differences in means 10,000 times. There were significantly more hypermethylated LINE-1 elements in windows containing piRNA clusters compared to windows not containing piRNA clusters for window sizes of 1-16 Mb. There was no difference in the number of normally methylated LINE-1 elements in windows containing piRNA clusters and windows not containing piRNA clusters for the same window sizes (as the 95% confidence intervals include zero).

