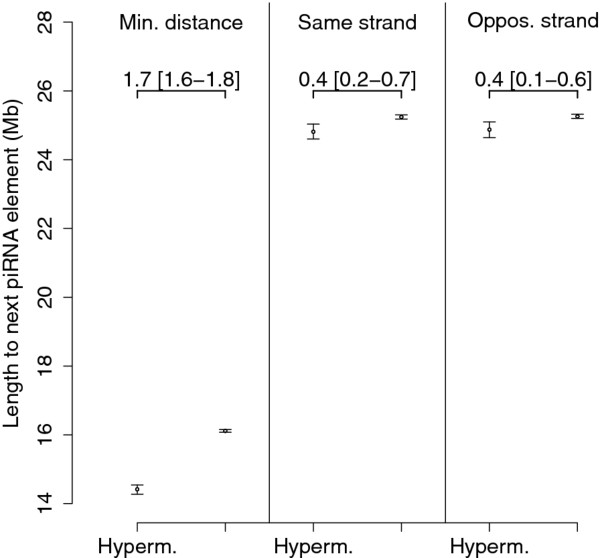
Figure 4.
Mean distances from LINE-1 elements to the next piRNA cluster on the same chromosome for hyperemethylated LINE-1 elements (Hyperm) and normally methylated LINE-1 elements (Normal). Shown is the absolute minimum distance (Min.distance) and the mean distance to the nearest piRNA cluster on the same and opposite strand. Bars indicate 95% confidence intervals estimated by calculating a bootstrap estimate of the means 1,000 times. The difference in means and 95% bootstrap interval is shown in the figure. The mean distance to the next piRNA cluster was significantly lower for hypermethylated LINE-1 elements than normally methylated LINE-1 elements, both the absolute minimum distance (14.4 [14.3-14.4] Mb vs. 16.1 [16.1-16.2] Mb), the distance to the nearest piRNA cluster on the same strand (24.8 [24.6-25.0] Mb vs. 25.2 [25.2-25.3] Mb) and the distance to the nearest piRNA cluster on the opposite strand (24.9 [24.6-25.1] vs. 25.2 [25.2-25.3] Mb).

