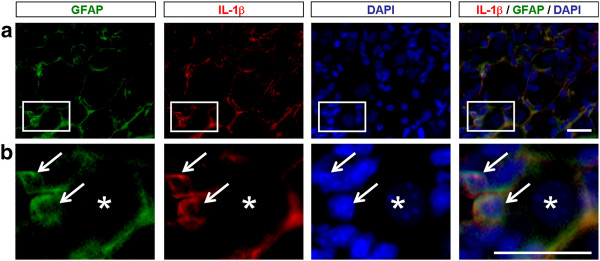
Figure 5.
Co-localization of GFAP and IL-1β in SGCs of DRGs. (A) Triple staining showing co-localization of GFAP (green), IL-1β (red), and DAPI (blue) in DRG-SGCs of morphine (2 h)-treated mice. Star and arrows indicate neurons and satellite glia, respectively. (B) High magnification images of boxes in A. Scales, 20 μm.

