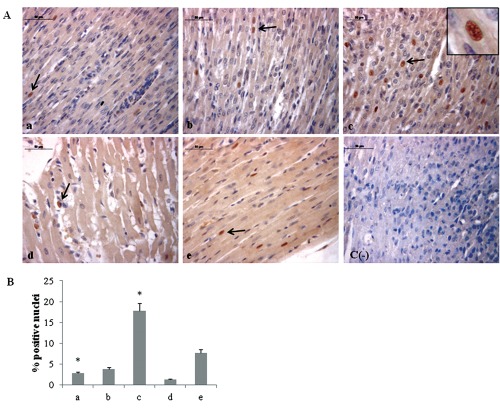
Figure 3.
A) Immunohistochemical detection of HIF-1α expression in neonatal rat heart; a) ambient air; b) 60% hyperoxia; c) 95% hyperoxia; d) ambient air 6 weeks; e) 60% hyperoxia and ambient air 4 weeks; c(−) negative control; arrows indicate HIF-1α positive nuclei; scale bar 50 µm; inset shows HIF-1α nuclear staining. B) Graphic representation of HIF-1α positive nuclei % (±SD) densitometric analysis determined by direct visual counting of ten fields (mean values) for each of three slides per sample at 40× magnification;*95% hyperoxia vs ambient air P<0.05.

