Figure 4.
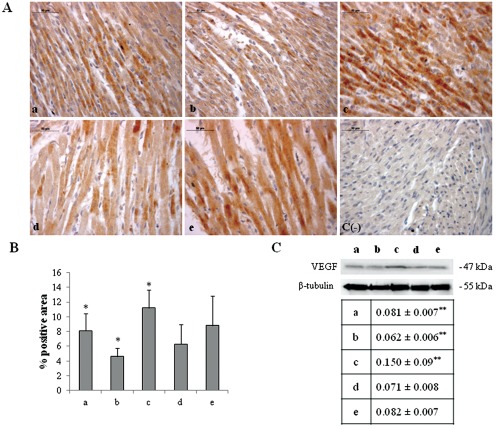
A) Immunohistochemical detection of VEGF expression in neonatal rat heart; a) ambient air; b) 60% hyperoxia; c) 95% hyperoxia; d) ambient air 6 weeks; e) 60% hyperoxia and ambient air 4 weeks; c(−) negative control; scale bar 50 µm. B) Graphic representation of VEGF % positive area (± SD) densitometric analysis determined by direct visual counting of ten fields (mean values) for each of three slides per sample at 40× magnification; *60% hyperoxia vs ambient air P<0.05; *95% hyperoxia vs ambient air P<0.05; *95% hyperoxia vs 60% hyperoxia P<0.05. C) Western blotting analysis of VEGF expression; each membrane has been probed with anti β-tubulin antibody to verify loading evenness. The most representative out of three separate experiments is shown. Data are the densitometric measurements of protein bands expressed as Integrated Optical Intensity (IOI) mean (±SD) of three separate experiments; **95% hyperoxia vs ambient air P<0.05; **95% hyperoxia vs 60% hyperoxia P<0.05.

