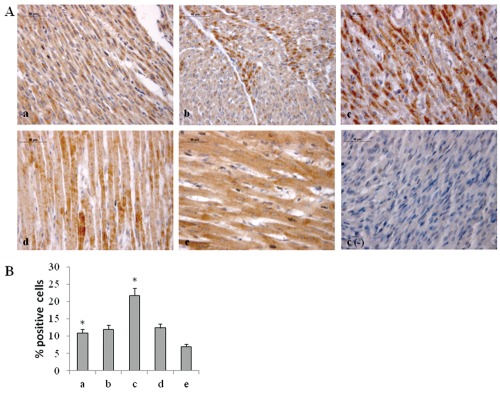
Figure 8.
A) Immunohistochemical detection of Bax positive cells in different experimental points; magnification 40×; a) ambient air; b) 60% hyperoxia; c) 95% hyperoxia; d) ambient air 6 weeks; e) 60% hyperoxia and ambient air 4 weeks; c(−) negative control; scale bar 50 µm; B) Graphic representation of Bax positive cells % (±SD) determined by direct visual counting of ten fields (mean values) for each of three slides per sample; *95% hyperoxia vs ambient air P<0.05.

