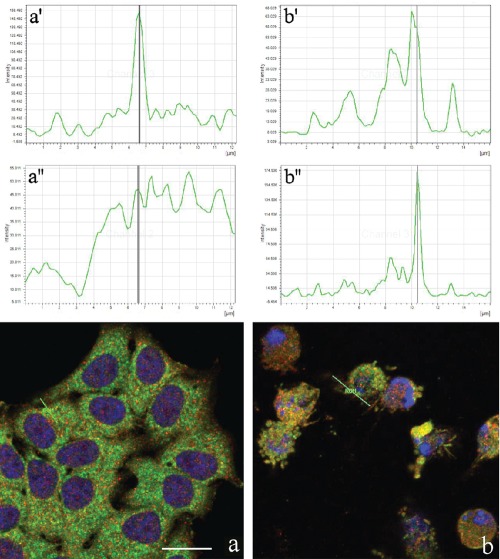
Figure 4.
Confocal optical sections after immunolabeling for Tanks (red fluorescence) and endoplasmic reticulum (green fluorescence): a) control HeLa cells b) cells treated with 1 µg/mL actinomycin D for 20 h. DNA was counterstained with Hoechst 33258 (blue fluorescence). Lines in a and b represent the region where fusion of green/red fluorescence was measured. Upper (a',b') and lower (a'',b'') panels refer to green and red fluorescence, respectively. Scale bar: 20 µm.

