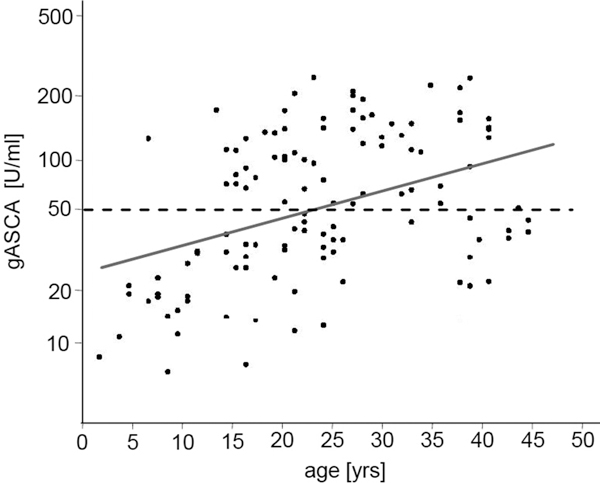
Figure 5.

Serum levels of gASCA are increasing with age in CF patients. Scatter-plot of gASCA according to age of CF patients. Bold line represents line of regression (log gASCA = 1.406 + 0.136 × age). Dashed line indicates threshold for positive anti-glycan titer ≥ 50 U/ml). Correlation between gASCA and age was statistically significant (Spearman's rank correlation rs = 0.39, p < 0.001).
