Figure 2.
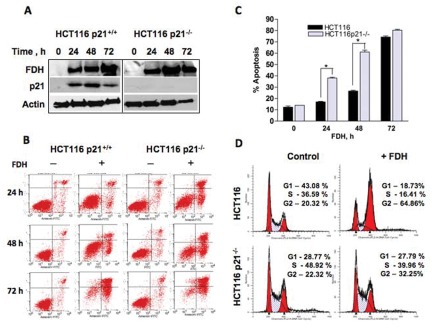
FDH-induced antiproliferative effects are different in HCT116 p21+/+ and p21−/− cells. (A) Levels of FDH and p21 proteins (Western blot) at different times after FDH transfection. Actin is shown as loading control. (B) Apoptosis evaluated by annexin V/PI staining in p21+/+ and p21−/− cells in the presence (+) and absence (–) of FDH. Time after FDH transfection is indicated. (C) Calculation of apoptotic cells (% of the total cells) from B. (D) Distribution of HCT116 p21+/+ and p21−/− cells between cell cycle phases at 48 hours after FDH transfection. Error bars represent ±SD. For statistical analysis, a Student t test was performed (*P < 0.05, n = 3).

